
In the August 2016 issue, we took a quick look at the applications of propositional logic to designing logic circuits. In part two of this two-part series on math for computer science, we’ll explore a second branch of discrete mathematics: graph theory.
In math class at most schools, students typically learn about a few types of graphs. There are charts, such as bar charts and pie charts and there is the Cartesian coordinate system with the x and y axes (and sometimes z). For students whose exposure to graphs does not go much beyond this, it may be difficult to understand why something called graph theory is taught in discrete math courses for computer scientists.
As it turns out, the definition of “graph” is much more general than what many students have learned. In graph theory, just about any set of points connected by edges is considered a graph. Although much of graph theory is best learned at the upper high school and college level, we will take a look at a few examples that younger students can enjoy as well.
To begin, it is helpful to understand that graph theory is often used in optimization. In other words, it can help us to find the quickest, shortest, cheapest, or otherwise most optimal way of achieving a goal. As such, let’s begin with a somewhat simple goal. Take a look at this illustration:

Pick a point and trace each edge. The goal is to get to every point without crossing another line or retracing a line. For example, line segment GJ cannot be drawn if the segment KI has already been traced (and vice versa).
One solution is to start at K, proceed to G, H, I, F, G, K, J, F, and to J, I
Depending of what the points and edges represent, and what we wish to optimize, we could create different conditions for how to traverse the map. In fact, herein lies the power of graph theory. The same general technique can be applied to very different optimization problems.
Let’s take a look at one classical problem studied in graph theory. The problem is known at The Seven Bridges of Königsburg. Könisgburg is a real city, now known as Kaliningrad. Part of the city is surrounded by the branches of a river, and at one time there were seven bridges connecting four sections of land in the surrounding area.
As the story goes, people in Kaliningrad wondered if it is possible to walk across each bridge exactly one time and visit each of the four sections of land that they connect. Part of Kaliningrad and the seven bridges are shown in purple below. The two light purple bridges are no longer there but were part of the original problem.

At the time the problem was first posed, no one was able to complete the task, however they could not prove whether or not it was possible.
Eventually, the mathematician Leonhard Euler realized that the map above could be abstracted down to a set of edges and dots, with the edges representing the bridges and the dots representing the land that they connect. He redrew the map above as something like the graph below:

Each orange dot represents one of the four bodies of land, and each purple edge represents one of the seven bridges.
In graph theory it is often useful to focus on one dot at a time, and count the number of edges coming in or out of it. In this case, three of the dots are attached to three edges (A, C, D), and one of the dots is attached to five (B). Euler used this type of graph to prove why the challenge is impossible. Can you identify the conflict that Euler discovered?
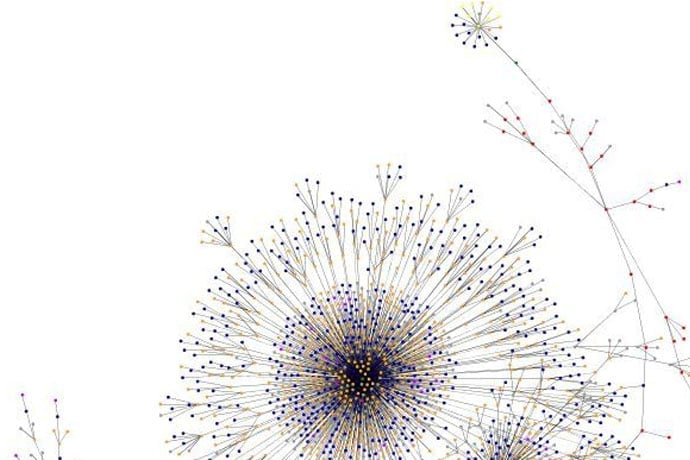
You might wonder how tracing lines and crossing bridges is applicable to computer science. One example is the world wide web. The Google search engine is based on the idea that each website is a node (dot) and each hyperlink connecting to it is a line (edge). The lines are given more weight based on an algorithm called PageRank that Google keeps secret and adjusts regularly. In fact, a rough graph of the web wouldn’t look all that different than Euler’s graph of the seven bridges of Konisgburg, with more dots and more lines.
In fact, much of computer science applies graph theory to solve optimization problems. To name a few, database design involves analyzing interconnections, network design involves finding the shortest paths, data structure involves minimizing data retrieval times, and computer hardware involves economizing memory space.
Curious about Euler’s proof that the seven bridges challenge is impossible? His thorough explanation requires several paragraphs, however consider the following. We must draw a line to arrive at each piece of land and a line to leave each piece of land. However, the pieces of land are connected to three lines (bridges). That means that each piece of land must be visited twice. But how can we visit multiple pieces of land twice, and only leave them once?
Learn More
Maps and Distance
http://illuminations.nctm.org/Lesson.aspx?id=2721
Graph Theory at MIT
PageRank
https://blogs.cornell.edu/info2040/2011/09/20/pagerank-backbone-of-google/
Math for Seven Year Olds: Euclidean Paths and Circuits
http://jdh.hamkins.org/math-for-seven-year-olds-graph-coloring-chromatic-numbers-eulerian-paths/
Seven Bridges of Konigsburg
https://www.youtube.com/watch?v=_OiZrmnni9Y
Discrete Math: Propositional Logic and Logic Circuits
https://kidscodecs.com/discrete-math-propositional-logic-logic-circuits/